
March 10 Update: Unmasking Our Schools
By Tai Huynh
Yesterday, the Ontario government announced that it will end mandatory masking for schools and most indoor public spaces on March 21, after March break. The policy change, part of the government’s reopening plan, was quickly met with criticisms from public health and pediatric experts, children’s hospitals, and school principals.
In the absence of a provincial mandate, individual school boards are now faced with the decision to maintain or scrap the requirement, which they can do through their own policies and procedures. The TDSB, for example, has scheduled a special board meeting this evening to discuss how to proceed. Should the school boards scrap the requirement, the decision to mask or not gets punted further down the line, to individuals.
In an ideal world, these decisions are made on the basis of risk. But assessing risk has become difficult since the province scrapped school-level case reporting, and with so many cases no longer picked up by PCR or tracked through RAT tests. However, data from the TCDSB—one of the few boards in Ontario that has continued to diligently track daily cases on its website—gives a fuzzy but informative picture of COVID at Toronto schools. It shows staff and student cases have declined since early February and held steady over the last two weeks. This pattern is consistent with the overall picture generated through wastewater surveillance in the community.
Because COVID is an airborne illness, we can expect cases to rise in the absence of masking. In removing the mandate, the provincial government appears to have accepted this eventuality. Here’s Dr. Kieran Moore’s statement from yesterday: “As a society, we must remain kind, considerate and respectful toward those who continue wearing a mask. We must also expect indicators, such as cases and hospitalizations, to increase slightly as Ontarians increasingly interact with one another.”
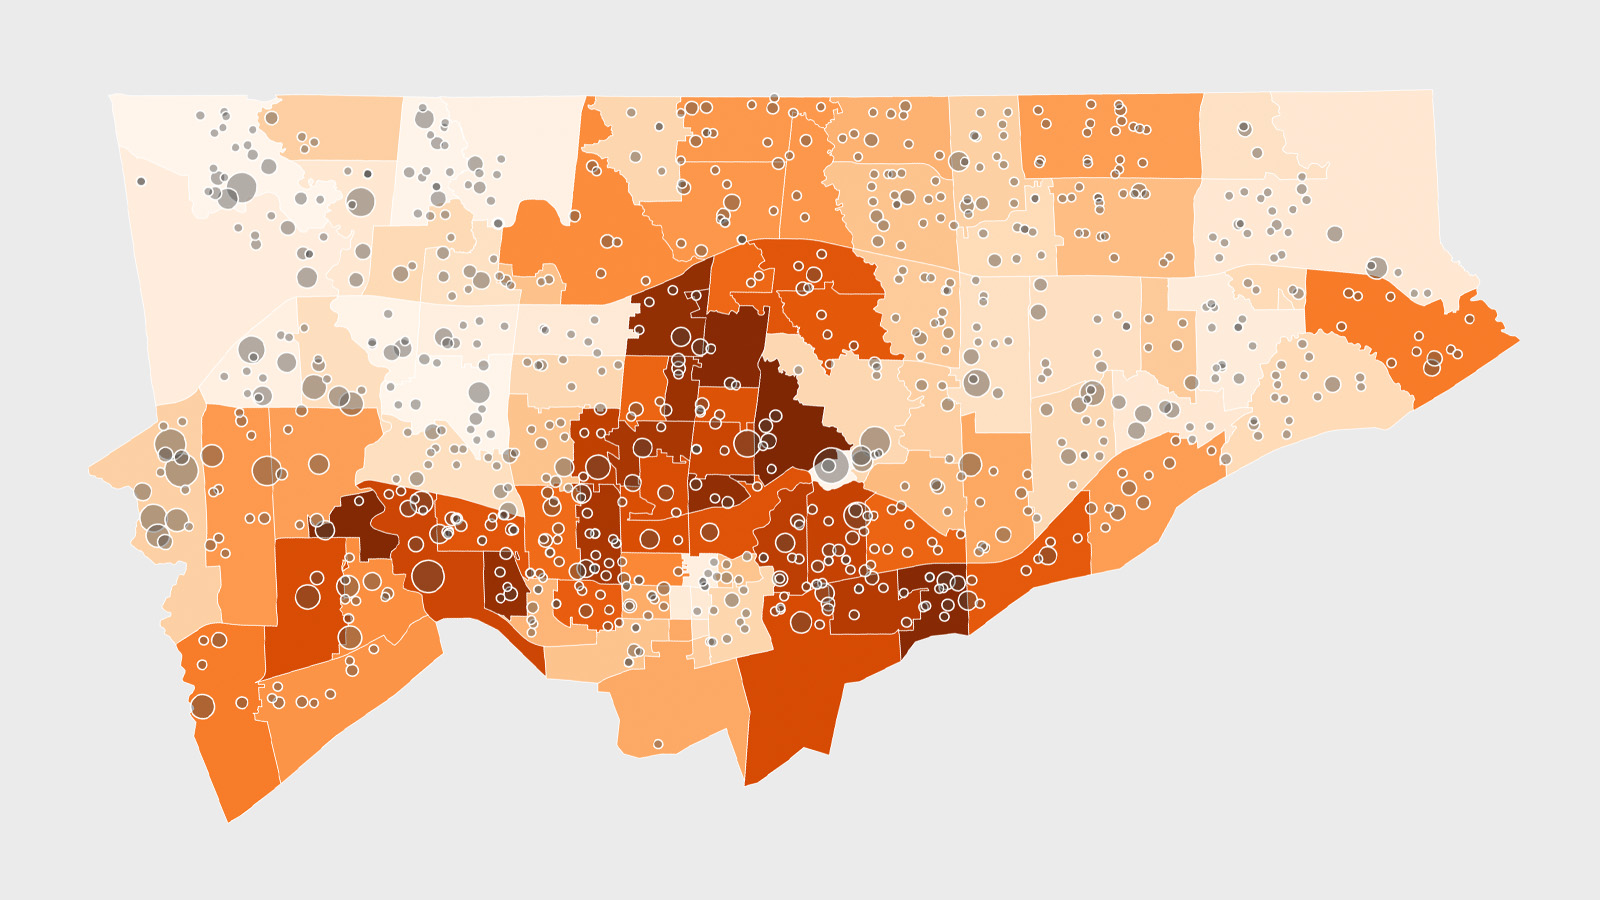
Even if things were to get “slightly” worse in the aggregate, staff and students in some areas of the city will face significantly higher risks without masks. Looking at vaccine coverage among kids aged five to 11, there’s a five fold difference between the most and the least vaccinated postal codes.
The most striking disparity is between Leaside (M4G) and Thorncliffe Park (M4H), adjacent neighbourhoods separated by socioeconomics rather than geography. In affluent Leaside, 73 percent of kids are fully vaccinated; in Thorncliffe Park, just 14 percent. In a place like Thorncliffe Park, with its large, multi-generational households and a low vaccination rate among adults, there’s a risk that things can quickly compound like they did in December 2020, when multiple schools in the area had to be shut down to contain the spread.
Of course, vaccination isn’t the only safeguard against COVID in the absence of masking. Immunity by previous infection also helps to reduce community risk. But we no longer know with certainty how many people have caught COVID and what that picture looks like across the city. We also don’t know the long-term health effects of contracting COVID. It is under these conditions of uncertainty—and with the virus still actively circulating—that school boards, and potentially individual parents, are being asked to weigh the risk-benefit of unmasking after March break. Some schools will do fine; they’ve always been fine. For others, masks are worth much more than their minor inconvenience.
***
January 28 Update: What We Know About Reopening
By Inori Roy
It’s been five days since the provincial government began releasing data on daily school absence rates, giving us our first window into the state of schools since reopening on January 19. The numbers are far from perfect: they don’t distinguish between teacher and student absences or between COVID and non-COVID absences, and school administrators have been given conflicting instructions on which students should be considered absent. Some schools are also missing from the data: the number of schools reporting their absence rates has risen since day one, reaching 76 percent at its peak on Wednesday.
At this point, absences are supposed to reflect students and staff who were expected to be physically present at school but aren’t, due to illness, COVID isolation (except those registered to switch to virtual learning for their isolation period), parents pulling them from in-person schooling, or any other reason. Some teachers and administrators are skeptical of whether the data accurately reflects what’s happening in schools. But despite a bumpy rollout and imperfections in the data, it’s one of the few tools we have to understand how the in-person reopening has gone in Toronto. Here’s what we know from the numbers, as well as interviews with teachers and administrators.
This week, average absence rates at Toronto school boards ranged from 7 percent at MonAvenir to 16 percent at the TDSB. The TCDSB reported an average of 10 percent, and Viamonde 13 percent. On the first day of data collection, Friday January 21, 73 schools across the city reported absences over 30 percent; that number dipped to 29 schools by January 27 (the most recent data), indicating that the snow last week—and the resulting delayed start, last-minute decisions and infrastructural gaps—may have driven absences on Friday. Interestingly, this week, the vast majority of absences of 30 percent or more have been at TDSB schools, with TCDSB and Viamonde (the French school board) reporting only 3 instances all week, and MonAvenir (the French Catholic school board) reporting none.
Initially, a 30 percent absence rate was understood to be the threshold at which the province had committed to notifying parents directly—but it turned out the province intends only to inform parents when schools reach an absence rate 30 percent higher than their normal absence rate. Some administrators describe still being in the dark as to what that normal baseline means—whether it should be the pre-pandemic absence rate, or the rate for the last two years—and further still, no one knows what’s supposed to happen once a school hits that threshold.
School cases are significantly higher than before the winter break. Because of a lack of case reporting, it’s unclear the extent to which the absences are driven by COVID infections. In a memo to school boards on December 30, the province announced it would no longer report COVID cases in schools, which it had done since the pandemic began. However, two school Toronto school boards—TCDSB and Viamonde—have elected to continue doing so on their websites. At Viamonde’s 15 Toronto schools, there were 44 new COVID cases between January 24 to 27. For comparison, these schools only had a combined 35 cases between September and December 2021. At the TCDSB, there were 327 new cases during the first week of reporting (January 21 to 27), compared to 581 cases between September and December 2021. Since cases are being reported to school administration at the discretion of staff and families, there is likely to be significant undercounting. Even so, the incomplete data show dramatically higher levels of infection among students and staff since schools reopened.
Alternative high schools are reporting higher rates of absences. Across the city, 14 schools—all in the TDSB—have reported absence rates higher than 30 percent for every day since the reopening. Of those, 10 were alternative secondary schools, and two were alternative elementary schools.
There are a few potential reasons for this. First, it’s important to remember that alternative schools have smaller populations than mainstream schools, meaning that higher rates of absence translate to smaller numbers of actual students. It’s impossible to tell the number of students absent at each school because that data hasn’t been made available, nor has information on how many students have opted into virtual learning.
Beyond that, alternative secondary schools often cater to older students; this is true of the schools found to have the highest rates of absence, like South East Year Round Alternative Centre, which serves students age 16-20, and had the highest average absence rate at nearly 70 percent since Friday. Older students, including those who are returning to high school after an extended absence or learning part-time to finish their diploma, are also often balancing jobs and supporting family members or young siblings. A review of TDSB alternative schools in 2016 also found that overall, those attending alternative secondary schools are from “slightly more socio-economically disadvantaged” backgrounds than their mainstream high school peers, and “noticeably more” than their alternative elementary counterparts. These students may be living in multigenerational households and having to consider the risks in-person schooling poses to older or very young family members, or deciding between work and school.
Substitute teachers are in short supply. There’s been a dearth of substitutes for years now, and it’s more evident than ever with a variant that seems to be hitting absolutely everyone, and in a profession where burnout rates are reaching new highs. At Nelson Mandela Park public school in Regent Park, a mix of positions that have been unfilled since the start of the school year and teacher absences over the last week mean that the school reopened with more than a dozen missing staff positions, around 30 percent of the workforce. The result, kindergarten teacher Sarah Kamrad told us, is that existing staff had to step into positions they just weren’t qualified for, with lunchroom supervisors filling in as early childhood educators and special education assistants for the first couple of days back in school.
“It’s risk management, absolutely. What is the greater risk: no person in the room, or a person in the room who’s not trained to do the job?” she says. “[But] the children deserve a person who is technically certified to be in the position.”
Right now, there’s no data indicating how many teachers are absent from the workforce, and it’s hard to tell whether Omicron has caused a significant spike in absences. There are a lot of reasons for teacher absences at this stage of the pandemic. “Life doesn’t pause for COVID,” Kamrad points out. Some teachers have chosen to take leave because of the risks in-person teaching pose to them or their family members’ health, but others are also dealing with medical and mental health concerns unrelated to the pandemic. What worries most teachers at this stage is the possible wave of COVID that could come from teachers and students congregating in schools every day.
Lack of access to protective resources is a universal problem. The Local spoke to teachers across the city about what they’re experiencing. All of them reported that they were provided with just a few N95 masks and a couple of rapid antigen tests (RATs), if any, to last them indefinitely. Administrators have described having to open up sealed five-packs of RATs to hand out one or two to teachers. And while many students have received a few RATs, they haven’t been given N95 masks to wear during school hours.
But none of that matters much when at lunchtime, all sense goes out the window, teachers add. All the protective measures instituted throughout the day—opening windows, masking up, turning on HEPA filters—is rendered null when anywhere from dozens to hundreds of kids simultaneously take off their masks to eat. For younger grades, this is usually in their classrooms with staff supervision (though staff remain masked and don’t eat at the same time); for high school students, lunch is spent in packed cafeterias or, at best, in hallways or outside in the snow. It doesn’t appear that many schools have put in place the precautions that could prevent this, like half-day cohorts where no one eats at school.
Some teachers have chosen to refuse unsafe work—a right under Ontario’s Occupational Health and Safety Act to choose not to work in conditions you believe to be a risk to your safety or anyone else’s. The process involves an investigation first at the employer level, and if not resolved, then by the Ministry of Labour. Anna Jessup, an elementary-grades teacher in Scarborough, has spent the week doing a work refusal. She’s a single parent to an 11-year-old daughter (who’s also staying home from in-person schooling), and can’t accept the risk teaching in-person might pose to herself, her daughter, and her students.
“When Doug Ford says you’re going to go back to school and teaching through a pandemic with minimal staff, no proper testing, […] that’s not safe,” Jessup says. “If it’s not safe for me, it’s not safe for the kids.”
For Jessup and others, going back to the classroom feels like going against the commitment teachers make to look out for the well-being of their students: “to go into the school right now is to take responsibility for something that you actually can’t manage.”
Just one day into in-person schooling, the provincial government announced that it was reopening indoor businesses at 50 percent capacity at the end of the month—a move that felt like a slap in the face to a lot of teachers, who hadn’t been given a chance to see whether their return to school raised case counts. So far, the province’s COVID numbers appear to be trending downward, but for those who spend every day in school with hundreds of students, a Monday reopening for businesses feels like an awful lot of pressure to put on the city’s already delicate ecosystem.
***
January 15 Update: What We Do and Do Not Know
By Tai Huynh
With school doors opening on January 17, I’m sure many of you are eager for information that will give you some sense of what the school environment will be like. Unfortunately, all of the daily information School Tracker had provided previously is no longer available.
On December 30, the province announced it would no longer report COVID cases in schools. In line with the provincial change, school boards have announced that they will discontinue case reporting on their own websites, which are the data sources for School Tracker. Outbreaks data will be similarly disrupted. The good news is both the TDSB and TCDSB have indicated that when individual schools become aware of a confirmed case of COVID, those directly impacted will continue to be informed.
The net effect of all of this is that School Tracker cannot continue in its usual form. Instead, it will pivot to reporting the information we do have: vaccination rates and, soon, school absences (available January 24, according to the province).
Vaccination rates for children 5 to 11 are picking up speed once again. There’s been reports out there suggesting that the rollout of the pediatric vaccine has plateaued. That’s true in some respects, but not entirely. First doses got off to a quick start over the initial 10 days after the vaccine campaign’s launch on November 25, 2021, then slowed down considerably for the remainder of 2021. Since the start of the new year, however, some of that initial momentum has been regained. Second doses have also picked up speed since the start of 2022, a clear indication that some parents aren’t waiting the recommended eight weeks between doses.
As written previously, although the federal government recommends an eight-week interval—and the Ontario government has made that the default—parents may consent to having their children vaccinated as early as three weeks between shots, per clinical trial (this can be done by calling the provincial booking line by phone, or requesting it at a walk-in vaccine clinic). The data shows that overall, second doses are trailing first doses by about six weeks at this point. In the face of the surging Omicron wave, and with in-person school resuming, this lag time could have been shorter had the option been more widely communicated and easily accessible through the booking system.
Vaccine coverage is vastly different across the city. Vaccination data is not available at the school level, but we can get a good sense of vaccine coverage within the student population by looking at rates in the surrounding community (of course, this is not quite true for schools where a large proportion of students do not reside in the immediate area, such as specialty schools for the arts). The data shows that, depending on the school, this can range from 27 to 82 percent for first doses, and from 2 to 34 percent for second doses.
It’s a pattern of disparity that should be familiar to our readers by now. It’s difficult to pinpoint the precise reason for this—it could be access, hesitancy, or other factors. The net effect is that the risk of contracting COVID will be significantly different depending on which school a student or staff attends. Of course, some of the difference will be made up through immunity by previous infections, which tends to be higher in the areas with lower vaccination rates. In fact, in some neighbourhoods in Toronto’s northwest where vaccine coverage is low, up to nine percent of individuals under the age of 20 have had symptomatic infections. That does not include asymptomatic cases and those missed by the laboratory PCR testing system. Regardless, it’s unlikely that immunity by previous infections, even if it could be fully accounted for, is large enough to make up for the sizable gaps in vaccine coverage. In order to keep the highly unvaccinated schools as safe as the more vaccinated ones, additional or more intensive public health measures are needed at those locations. It’s the kind of risk-based approach adopted during the previous school year, but abandoned in the current one.
Data from September to December was truly magnificent, but it’s time to say goodbye. The data from the period before the winter break was rich in detail and timely in frequency, and we are unlikely to see such high quality data again for the remainder of the pandemic. School Tracker’s staple charts and tables from that period are archived below for posterity.
***
October 12 Update: One Month Later
By Tai Huynh
It’s now been a full month since the school year began. Here’s what we know so far about COVID in Toronto’s public schools:
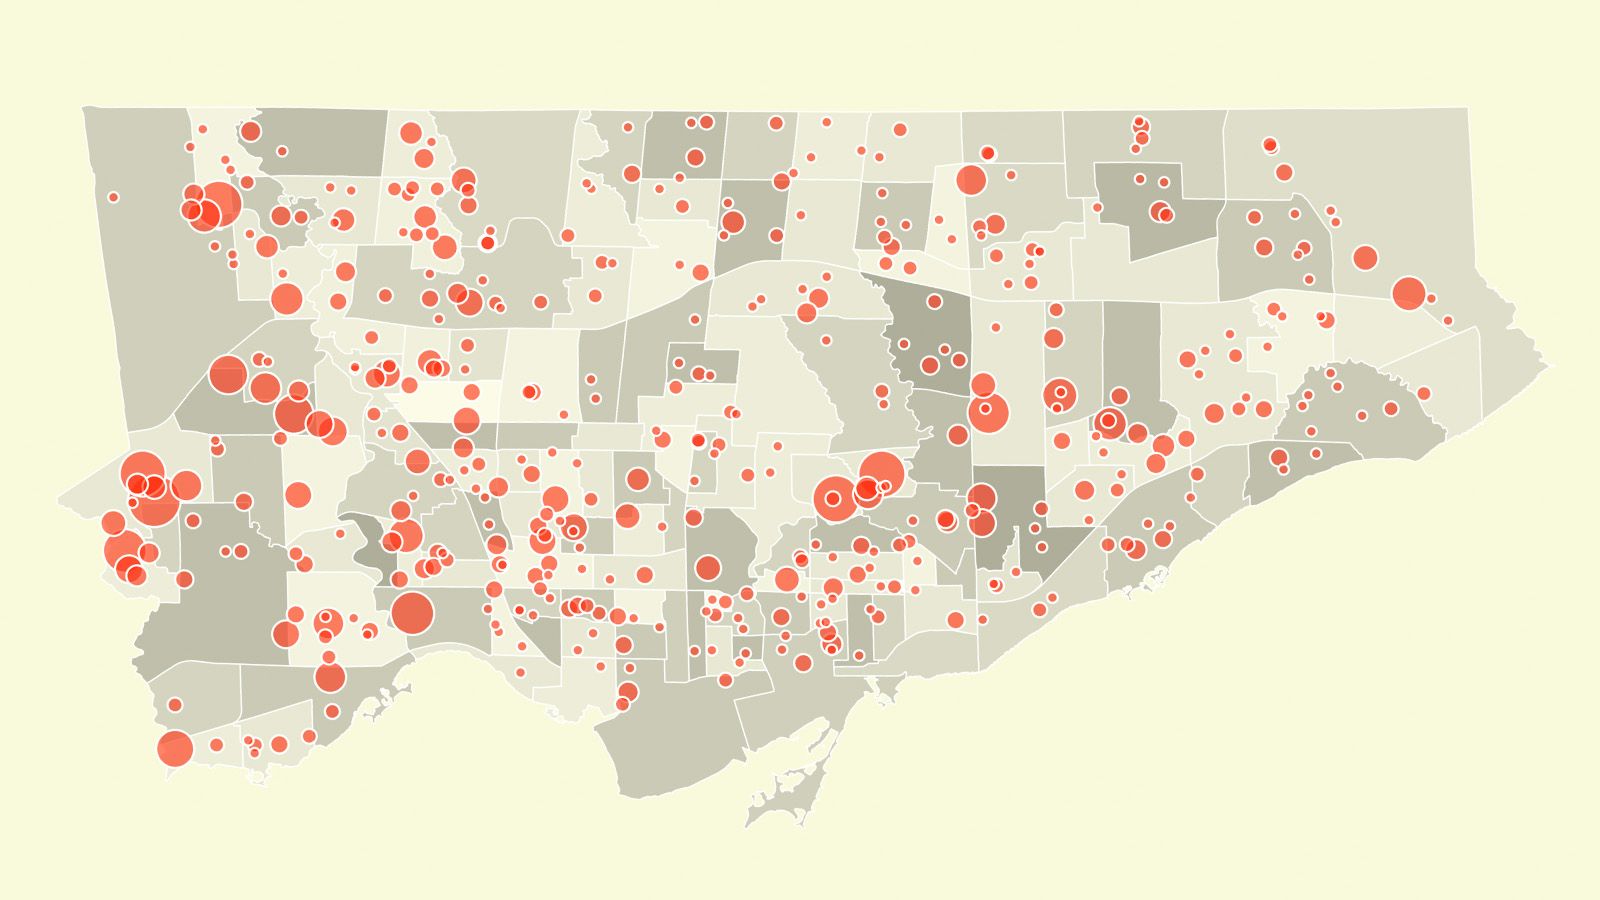
A third of schools have had at least one COVID case, but that doesn’t mean that schools are unsafe. Toronto has 815 public schools across the four school boards, and 260 (32 percent) of them have had one or more COVID cases since the start of the school year, for a total of 466 cases. Last year, according to Toronto Public Health, the majority of schools affected by COVID involved single cases, implying that most cases were acquired in the community and were not the result of person-to-person spread within the school (see September 8 post). So far this school year, that’s been true as well. Of the 260 schools affected by COVID thus far, 145 (56 percent) involved single cases, while 115 (44 percent) involved multiple cases.
Single cases aren’t necessarily a bad thing when assessing the safety of schools. “The headlines always seem to trumpet how many overall cases there are, but if the vast majority are one-offs that get picked up, to me that’s a good news story,” tweeted Shannon Proudfoot in a Twitter exchange we had a couple of weeks ago. To appreciate what Proudfoot was saying, imagine the scenario where schools are suddenly closed. Would all the single cases just disappear from the city? Unlikely. They are school cases by association rather than by origin—sneaky viruses caught by the school screening procedures and snuffed out before they could do further damage. The best way to minimize these types of cases is through greater vaccine uptake in the surrounding community where they originate.
Outbreaks are the real threat. Whenever there are two or more cases at a school, there’s the potential that person-to-person transmission has occurred on premise, i.e. an outbreak. Strictly speaking, an outbreak is declared by TPH only if their case investigation concludes that there are at least two lab-confirmed cases with an epidemiological link, where at least one case could have reasonably acquired their infection in school. That means that while all outbreaks involve multiple cases, not all multiple cases constitute an outbreak. Of the 115 schools with multiple cases so far this year, 35 were declared outbreaks and they involved a total of 130 COVID-positive students and staff. Is that a big number? It depends on how you look at it. On the one hand, there are 400,000 students and staff in Toronto’s public schools, so that’s a mere 0.03 percent of the public-school population. On the other hand, any outbreak is significant because of the potential for things to quickly spiral out of control, as we saw in several schools in Ottawa last week and in the closure of Silverthorn CI in Etobicoke this week. There are also reverberating effects on students and staff throughout the school in terms of potential disruptions and dismissals.
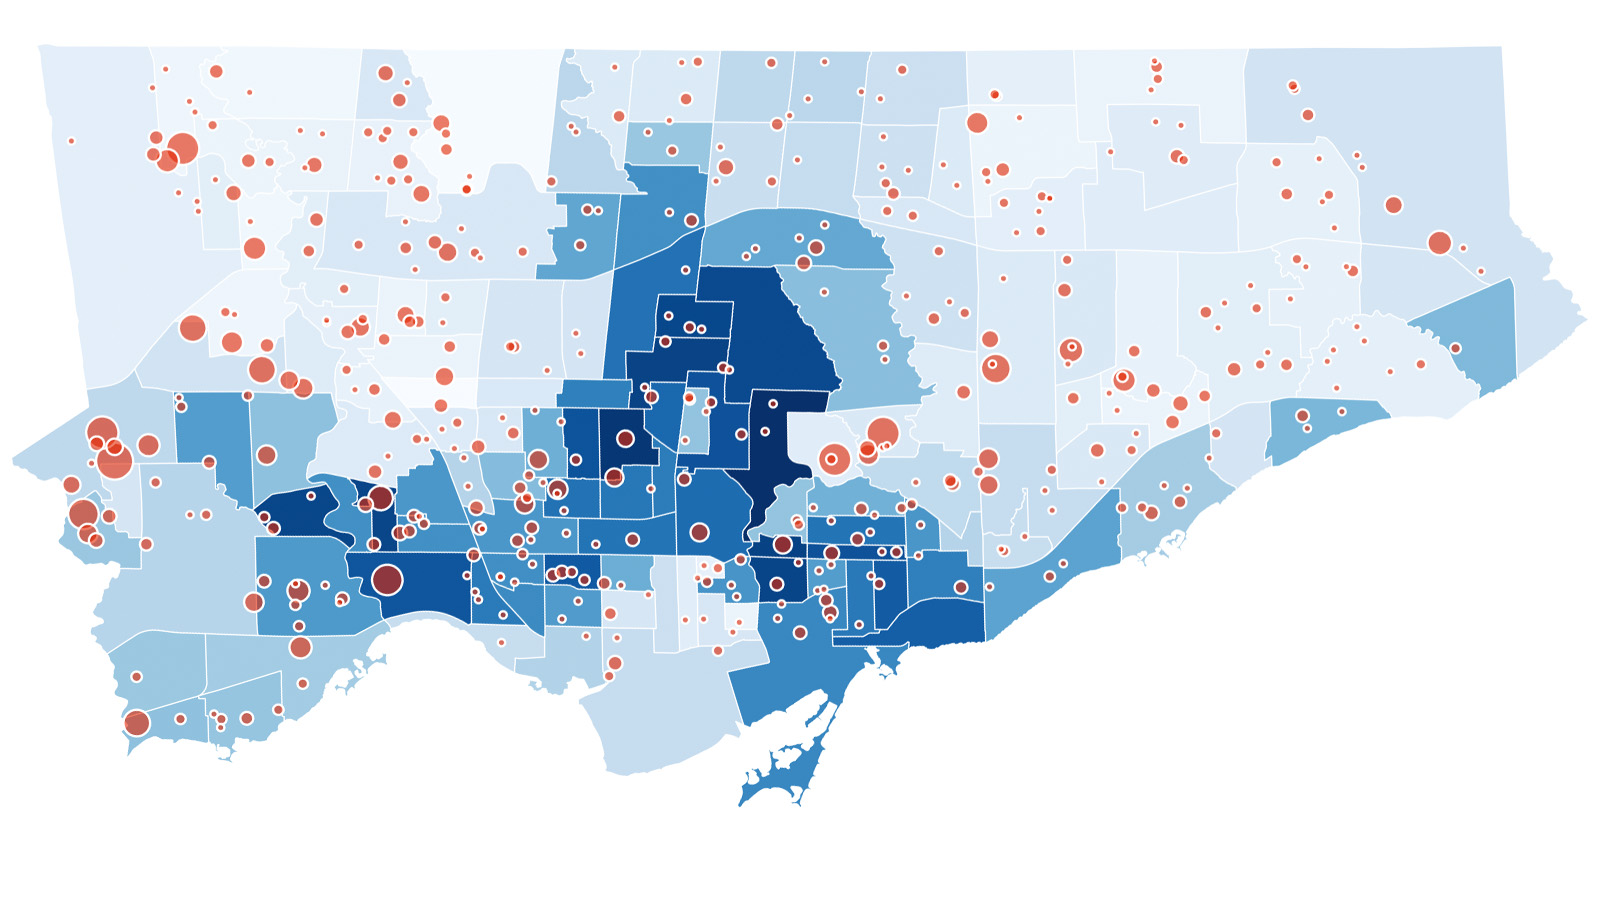
Schools in high-risk areas are three times more likely to experience an outbreak. Back in August, The Local developed risk scores—on a scale of one to five, with five being the highest risk—for each public school in Toronto based on the surrounding community’s vaccine coverage and its historical propensity for COVID infections. (We’ve since updated the risk scores, in School Tracker, to account for recent changes in vaccine coverage). We reasoned that schools located in high-risk areas would be more prone to outbreaks compared to their counterparts in lower-risk areas of the city. So far, this has been true. Among the highest risk (level 5) schools, nine percent have experienced an outbreak, compared to just three percent for all other schools in Toronto.
On October 5, the Ontario government announced that it was rolling out rapid antigen screening to schools where the risk of transmission is high. The schools on our high-risk list would make a good starting point for the new program.
The province’s data portal under-reports school cases by 30 to 50 percent. The Ontario government’s website that is supposed to be the authoritative source for COVID data in Ontario schools—churning out daily numbers that are frequently quoted by various media outlets—is completely unreliable. As of October 8, it showed that Toronto had 206 confirmed cases at 125 schools. Our data showed 310 cases at 193 schools.
Perplexed by the huge discrepancy, I contacted the school boards. “Sometimes there is a lag in reporting, so it could appear on the TDSB site before the provincial website,” said Ryan Bird of the TDSB.
“Note that what is published on MonAvenir’s website is accurate,” said Mikale-Andrée Joly of the French Catholic school board. “Please rely on this data [as opposed to the provincial data] when looking at the total number of cases in our schools.”
Since The Local pulls data directly from the school boards’ websites nightly, we are confident in the timeliness and accuracy of our School Tracker.
According to school board protocols, whenever there’s a positive case, parents and the school community are the first to be notified, then the info gets posted on the board’s website before being reported to the province. With that dataflow in mind, it’s reasonable to assume that the provincial under-reporting is just a timing issue—a ten-second television delay that’s inconsequential and only noticeable when viewed side-by-side with the live action. Turns out, it’s more than simply a lag in the feed; it’s like watching a scrambled TV channel in the eighties where the picture is distorted just enough that you’re not quite sure what you’re looking at.
A deeper examination of the provincial website revealed a litany of errors and omissions. For example, on October 4, it showed 14 confirmed cases at École Saint-Jean-de-Lalande in Scarborough. In actuality, there were only two. At another school with two cases, the province reported 12. I brought these errors to the attention of the school board, which in turn notified the Ministry of Education, and the swollen numbers were subsequently revised. Conversely, we have schools like Dante Alighieri Academy, St. Jude Catholic School, and Huron Street JPS—all with active outbreaks—that are completely absent from the provincial website.
I cannot speak to the accuracy of the entire provincial dataset, but looking at just the Toronto portion, I have great reservations about relying on the provincial data to make decisions about the safety of public schools at this time.
***
September 15 Update: Going Live
By Tai Huynh
And we’re live. School Tracker is now updated daily with the latest COVID data from Toronto’s 800 schools. I will post a commentary about it (like this post) roughly once a week, if there’s something worth writing about.
When The Local announced the School Tracker a week ago, we assumed we’d be using the school-by-school COVID numbers provided by the provincial government, data it had updated daily during the previous school year. The very next day, when school began, I discovered that the government website that supplied the data had gone dark. This meant that anyone interested in getting a full picture of COVID in Ontario’s schools had to visit the individual websites of all 84 school boards, each with their own reporting format and frequency. With cases changing on a daily basis, staying up to date seemed daunting. And to be perfectly honest, at that point, I seriously doubted the viability of our School Tracker, even if we’re only monitoring cases in Toronto’s four school boards. That’s when Vaccine Hunters Canada reached out.
With some coding wizardry from Andrew Young, founder and director of the volunteer-run non-profit that helped millions of Canadians get vaccinated, we now have a tool that automatically pulls data from the school boards’ websites daily. It essentially combs through the disparate sources of information and brings it all together in a common format, in real time—the same formula that made Vaccine Hunters Canada the go-to source during the Hunger Games phase of the pandemic. Here, it allows me to focus on analyzing and visualizing the data, and asking critical questions, instead of being a data gopher.
The data show that as of 6:00 p.m. on September 14, 38 public schools in Toronto had active COVID cases. For comparison, there were active cases at just 10 schools after the first week last year (although it was a staggered start over the first couple of days). Among those with active cases, 13 are secondary schools.
While the sample size might be too small to draw any definitive conclusions at this point, it’s worth pointing out that the great majority are single cases. This means that there’s been minimal transmissions within schools thus far, and that community transmission is the dominant source of infections.
This is reinforced by the fact that the majority of the schools with active cases are located in higher-risk neighbourhoods. Last month, The Local developed risk scores—on a scale of one to five, with five being the highest risk—for each public school in Toronto based on the surrounding community’s vaccine coverage and its historical propensity for COVID infections. Of the 38 schools with active cases, 22 are located in areas where the risk level is four or higher. In contrast, only six schools with active cases are located in areas where the risk level is two or lower.
The early takeaway is that vaccination continues to be our best defense against school infections; classrooms are safe when the community is safe. And while still early in the new school year, a familiar pattern has emerged: Toronto’s socio-spatial disparity. It’s no accident that high-risk schools are located in low-income, racialized neighbourhoods, precisely the ones where kids cannot stay home and parents cannot afford to miss work. They’re places where, with additional resources, public health measures could be enhanced, class sizes could be reduced, and large outbreaks and disruptions could be prevented.
At the time of posting, the provincial government had reactivated the data portal that had been offline since school began last week. However, it reports only 13 Toronto schools with active cases, while the school boards themselves indicate that there are 38 PHU-confirmed cases. It’s a big discrepancy, but one that the province openly acknowledges. “If there is a discrepancy between numbers reported here and those reported publicly by a Public Health Unit, please consider the number reported by the Public Health Unit to be the most up-to-date,” says the disclaimer on the provincial website.
On that basis, we’ll be sticking with our jerry-rigged tool to pull data directly from the school boards to update our School Tracker daily. Huge thanks to Andrew Young for helping us out.
***
September 8 Update: Looking Back at Last Year
By Tai Huynh
With schools starting this week, The Local is launching a new data blog to track COVID-19’s footprint across Toronto’s 800 public schools. The blog will be updated weekly (or as frequently as necessary) with maps, analysis, and commentary as the school year unfolds.
To start, let’s recap what happened last year. As soon as the doors opened on September 14, 2020, four TDSB schools reported positive cases. A few days later, the TCDSB got its first case. Active cases continued to climb throughout the months of September through December. By December 18, the final day of school before the winter holidays, there were active cases at 279 schools, more than a third of all public schools in Toronto.
The most dramatic scenario took place at schools in Thorncliffe Park and the adjacent neighbourhoood of Flemingdon Park. In November, Toronto was deep into the second wave, and the Thorncliffe Park neighbourhood had become the epicentre: the test positivity rate in the area had shot up to 16 percent. The city average, in comparison, was 6 percent. But cases did not spike at Thorncliffe Park Public School as anticipated. An initial batch of 433 tests of asymptomatic students and staff at the school found 19 cases previously missed. More cases were discovered in the subsequent days, and on December 3, officials decided to shut down the entire school. Dozens of cases were also discovered at Fraser Mustard Early Learning Academy, Grenoble Public School, and Marc Garneau Collegiate—all within a 15-minute walk of Thorncliffe Park Public School. One by one, they were all shut down.
The fact that many children had COVID but showed no symptoms suggests that the data under-reports infections in schools. That aside, the province decided to keep students at home after the winter break, during the peak of the second wave, when new cases were well above 3,000 a day in Ontario. By Valentine’s Day, new cases were back down to around 1,000 a day, and kids were back in school. Throughout the month of March, as Ontario entered the third wave, school cases started to climb to new heights. At the peak, on April 6, 356 schools had active cases, close to 44 percent of all public schools in the city. The province decided to close schools to in-person learning after April 9.
By the end of the tumultuous 2020-21 session, 87 percent of the more than 800 schools at all four boards had had an active case at some point during the year.
Despite the many cases found, Toronto Public Health indicates that student-to-student transmission was low. “Last year, the majority of COVID-19 related to schools in our city had single COVID-19 cases,” said Vinita Dubey, Toronto’s associate health officer.
According to Dubey, while the virus was able to enter the schools, once there, the many layers of public health measures implemented by her health department and the school boards were effective at preventing further transmission. “It is important to remember that the cases in schools were a reflection of COVID-19 spread in our community,” said Dubey. “Since COVID-19 was circulating in the community, [school] cases related to community transmission were expected at the time.”
As students and teachers return to the classroom this week, it’s comforting to know that while almost every school had COVID, large outbreaks were uncommon. At the same time, last year’s experience isn’t a perfect barometer for what’s to come. This year, students are going back to school in the face of a more transmissible variant, with fewer restrictions in the community, and without smaller class sizes. And while we have a new layer of protection in vaccines, coverage is uneven, with some areas of Toronto barely 50 percent fully vaccinated.
How the 2021-22 school year unfolds is anybody’s guess. Check back regularly for live updates. You can also subscribe to our newsletter at the bottom of the page.
More from this issue

How to Feed the Future
Canada is the only G7 country without a national school food program—instead, we have piecemeal provincially-funded programs that are leaving children behind.
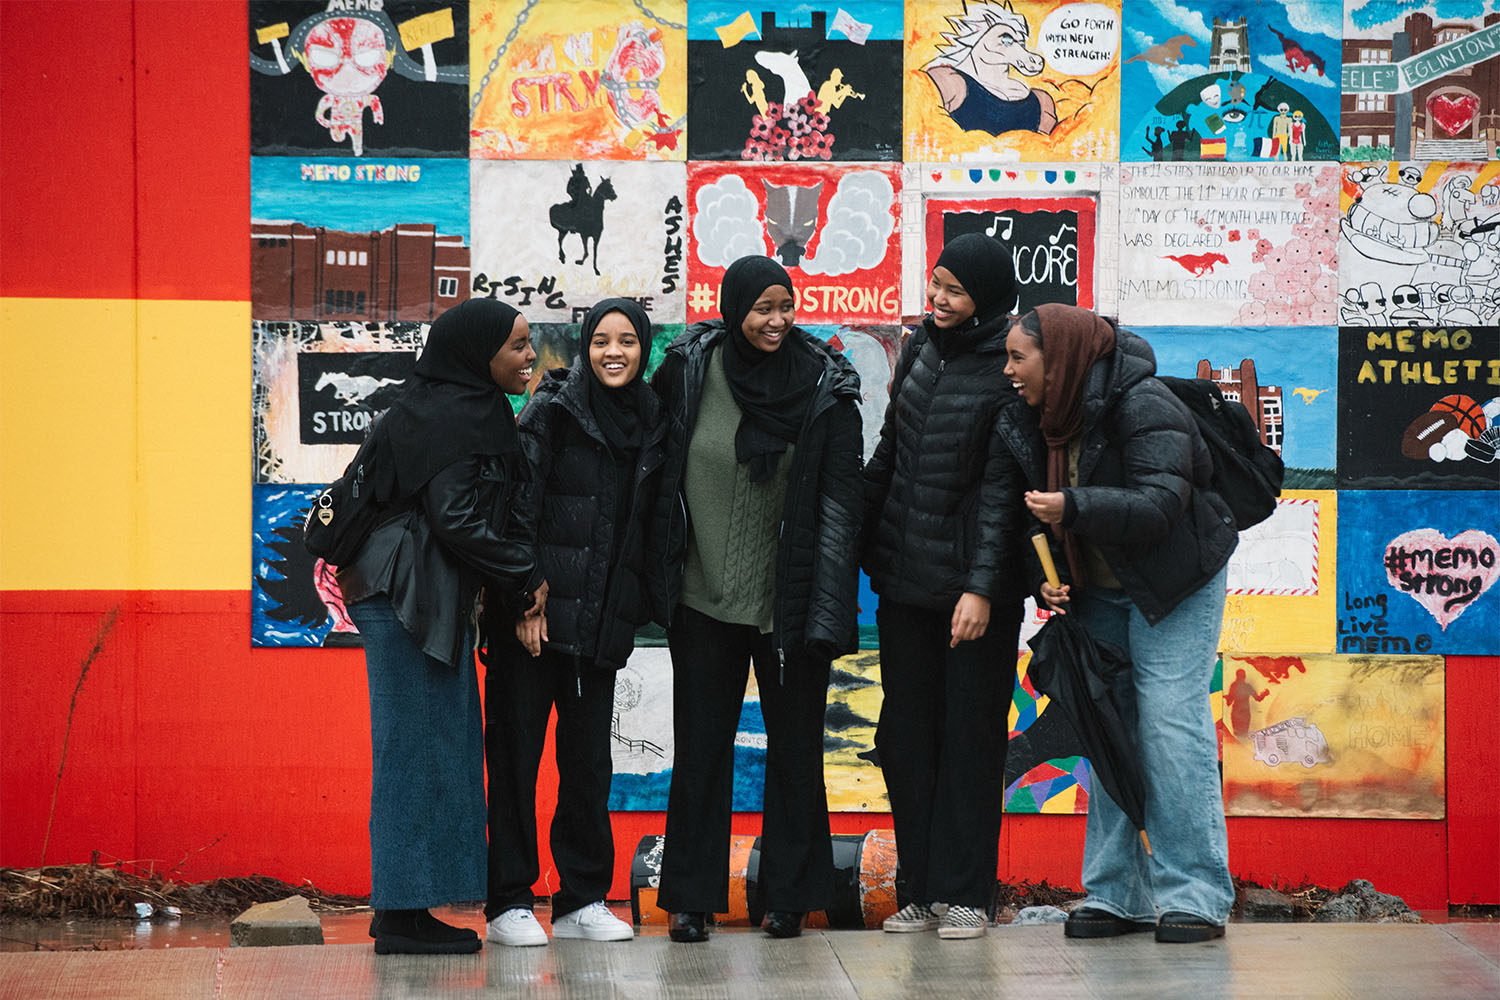
Fires, Plagues and Also High School
Their school burned down, they survived a pandemic, and endured the ordinary teenage heartbreaks and triumphs under extraordinary conditions. Within the chaos, these York Memorial students found each other and their purpose.
Two School Shootings, 15 Years Apart
The 2007 shooting of Jordan Manners sparked a massive review of school safety. With another fatal shooting last month, advocates are asking what has changed, and what hasn’t, in the years since.

The Kids Left Behind
Shuttered autism services, kids caring for younger siblings, undiagnosed developmental conditions—for many students, the losses of the last two years go well beyond school closures.
Childcare is an Essential Service and a Dysfunctional Business
With ECEs fleeing the industry and a federal childcare deal on the horizon, now is the time to fix a long-broken system.
A Week After Launching RAT Tracker, We’re Still in the Dark
What we learned from our participatory data project asking Torontonians to share rapid antigen test results.
RAT Tracker
A citizen-powered tool for anonymous reporting of rapid antigen test results in Toronto public schools.

How to Keep Schools Open
None of it’s easy. All of it’s urgent.
Kids Vaccines Aren’t Reaching the Toronto Neighbourhoods That Need Them Most
Data from the first weeks of the rollout reveals low vaccine uptake in areas with the largest school outbreaks.
Fighting Vaccine Hesitancy at Alternative Schools
High vaccine exemption rates have long been a feature at Toronto alternative schools, but as COVID vaccines roll out to kids, there’s a new urgency to reach these hesitant parents.